Mohamed Ali Ben Jemaa, Data Scientist, Giga ITU
Giga’s core mission is simple: support governments in connecting every school to the internet by 2030. As of 2026, hundreds of millions of students worldwide still lack access to any meaningful connectivity. But the challenge is not just social or financial; it’s also deeply technical.
To achieve universal school connectivity, governments need precise answers to critical questions: where to build or upgrade infrastructure, what technology to use and how much it will cost at both the country and school levels.
Producing estimates at this level of granularity requires combining diverse inputs from telecommunication operators, regulators and ICT ministries. Turning this mishmash of inputs into refined, actionable insights is no small task, but it’s exactly what Giga is designed to do.
Trustworthy Data
Giga’s infrastructure analysis begins the moment data starts being received from participating countries. This data used is wide-ranging — school, cell tower, fibre node, and mobile coverage locations, electricity access and road transport network — plus local microeconomic indicators such as population counts and income levels. The first step is to validate these datasets to ensure they are complete, accurate, consistent, timely and meet our requirements.
“Garbage in, garbage out” is the biggest risk in a project like this. Our infrastructure models are only as good as the data that goes into them, and earning trust in our recommendations starts with credibility of the datasets themselves. Because of this, the timeframe for data collection and validation can vary.
We collaborate with country stakeholders to refine and rework the data until it meets our quality standard. Only then can we start ingesting the data into our analysis pipeline.
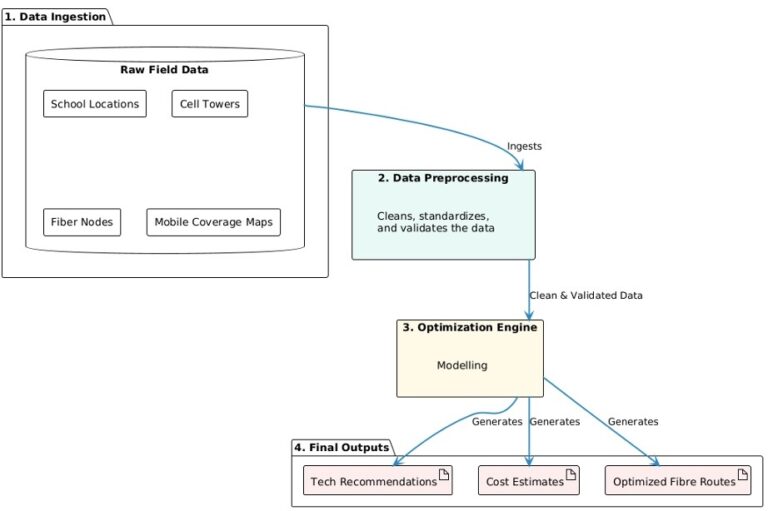
Image 1. Giga Analysis Framework Pipeline
The Data Pipeline: Raw Imports to Analysis-Ready Results
In data engineering, the process of data integration, known as “extract, transform, load,” or ETL, makes it possible to onboard country data from collaborating governments even when it arrives in completely different formats.
Before any model runs, the ETL pipeline normalizes heterogeneous field data through the following steps:
- Maps non-standard column names, reprojects coordinate systems and standardizes encoding.
- Runs quality checks that flag anomalies such as duplicates, out-of-bounds coordinates and missing values.
- Outputs cleaned data into a well-organized folder structure.
The Data Engine
Once the data has been cleaned and prepared, we run our optimization models. These models run automatically as scheduled jobs in a scalable cloud analytics environment. This setup is designed for continuous, repeatable use. Everything the team relies on is version controlled, tested and deployed through an automated system.
In practice, this means every country goes through the same reliable pipeline, and updates can be rolled out safely and consistently. That’s what allows us to scale from one country to 100 without rebuilding the process each time.
The most demanding modeling tasks run on dedicated, memory-optimized compute clusters, while lighter workloads are handled by cost‑efficient, serverless processing environments. This lets us match each task to the right level of computing power, so we only use—and pay for—what we actually need.
Model outputs are stored in an open‑source table format that applies updates safely and keeps a complete history of changes. This allows past results to be reviewed or rolled back when needed.
Optimization
Model 1: proximity, coverage & demand (PCD)
The first phase of modeling focuses on building situational awareness. The PCD model identifies which schools are close to existing connectivity infrastructure, and which are in connectivity deserts. It also estimates how much bandwidth each school is likely to need.
- Proximity: Measures the distance from each school (point of interest) to the nearest cell towers and fibre transmission nodes.
- Coverage: Determines whether each school falls within a mobile coverage area, using operator-supplied maps with the option to fall back to cell-site buffers when needed.
- Demand: Uses population raster data to estimate the number of school-age users within a 1-5 km radius and calculates the expected bandwidth demand for each school.
Model 2: Optimal fibre network routing
In this phase of modeling, computational elegance meets real‑world constraints with a practical question: if we were to extend fibre to every school, which routes would minimize total cable length while connecting all schools to existing backbone nodes?
To answer this, we use road‑network data to ensure proposed routes follow on-the-ground paths. The pipeline implements a Minimum Spanning Tree approach, which connects all locations using the shortest possible total network distance. Starting from fibre transmission nodes, schools are linked together in the most cost-efficient configuration. Once complete, it generates a fibre path for each school, the total distance to connect it, and a network topology showing all nodes and connections.
Model 3: Visibility and line-of-sight analysis
Many connectivity solutions require a clear line-of-sight to a nearby cell tower. To assess whether this is feasible for a particular school, we use NASA’s Shuttle Radar Topography Mission (SRTM) digital elevation model to detect any terrain obstructions between each school and nearby 4G/5G towers.
This model computes line of sight within a configurable search radius and produces two outputs: a simple yes/no indicator showing whether visibility exists, and the geometry of the visible link when it does. Without this analysis, there’s a risk of recommending a point-to-point microwave connection to a school blocked by mountains or ridgelines. Incorporating visibility analysis ensures that only technically viable links are proposed, saving time and resources.
Model 4: Cost model and technology assignment
The final phase of the modeling step — and arguably the most important — is cost optimization. This model determines which technology should connect each school and estimates the full cost of delivery over a 10-year project period. It calculates Total Cost of Ownership (TCO) using Net Present Value (NPV), accounting for the full lifecycle of each solution, including:
- Hardware implementation costs
- Infrastructure construction costs (fibre cable per km, tower installation)
- Hardware reinvestment cycles
- Annual maintenance, ISP fees and traffic fees
This model produces cost estimates for each school. It can also run a budget-constrained optimization that caps total spending and prioritizes the highest-value schools within the available budget.
Multi-Scenario Analysis
Ministers, funders and implementing partners rarely align on a single planning scenario. Multi-scenario outputs let stakeholders explore trade-offs visually rather than requiring a new analysis run for every “what if.” A key design feature is the ability to rerun the same analysis under different assumptions. For example, fibre path optimization can be run at 2 km, 5 km, and 10 km maximum connection distances within a single output, and the cost model automatically links each routing scenario to its corresponding cost estimate.
This system can also incorporate country-specific specific technology preferences or constraints and generate tailored scenarios accordingly. Similarly, it can contrast what is achievable within a fixed budget versus an unconstrained scenario.
Insight to Implementation
Giga’s infrastructure planning combines reliable data, scalable engineering and country‑specific modeling to produce actionable, evidence-based pathways for school connectivity — where to build, what to build and how much it will cost. The goal is to give governments and partners the confidence to invest in viable, bankable infrastructure that can bring meaningful connectivity to every learner, everywhere.
About the Author

Mohamed Ali Ben Jemaa specializes in data science and modeling for predictive and prescriptive analytics, and is currently supporting data collection and validation in countries where Giga is engaged. He is based in Montreal, Canada.