
Author: Maria Antonia Bravo, Technology Programme Manager, Digital Inclusion & Giga, UNICEF
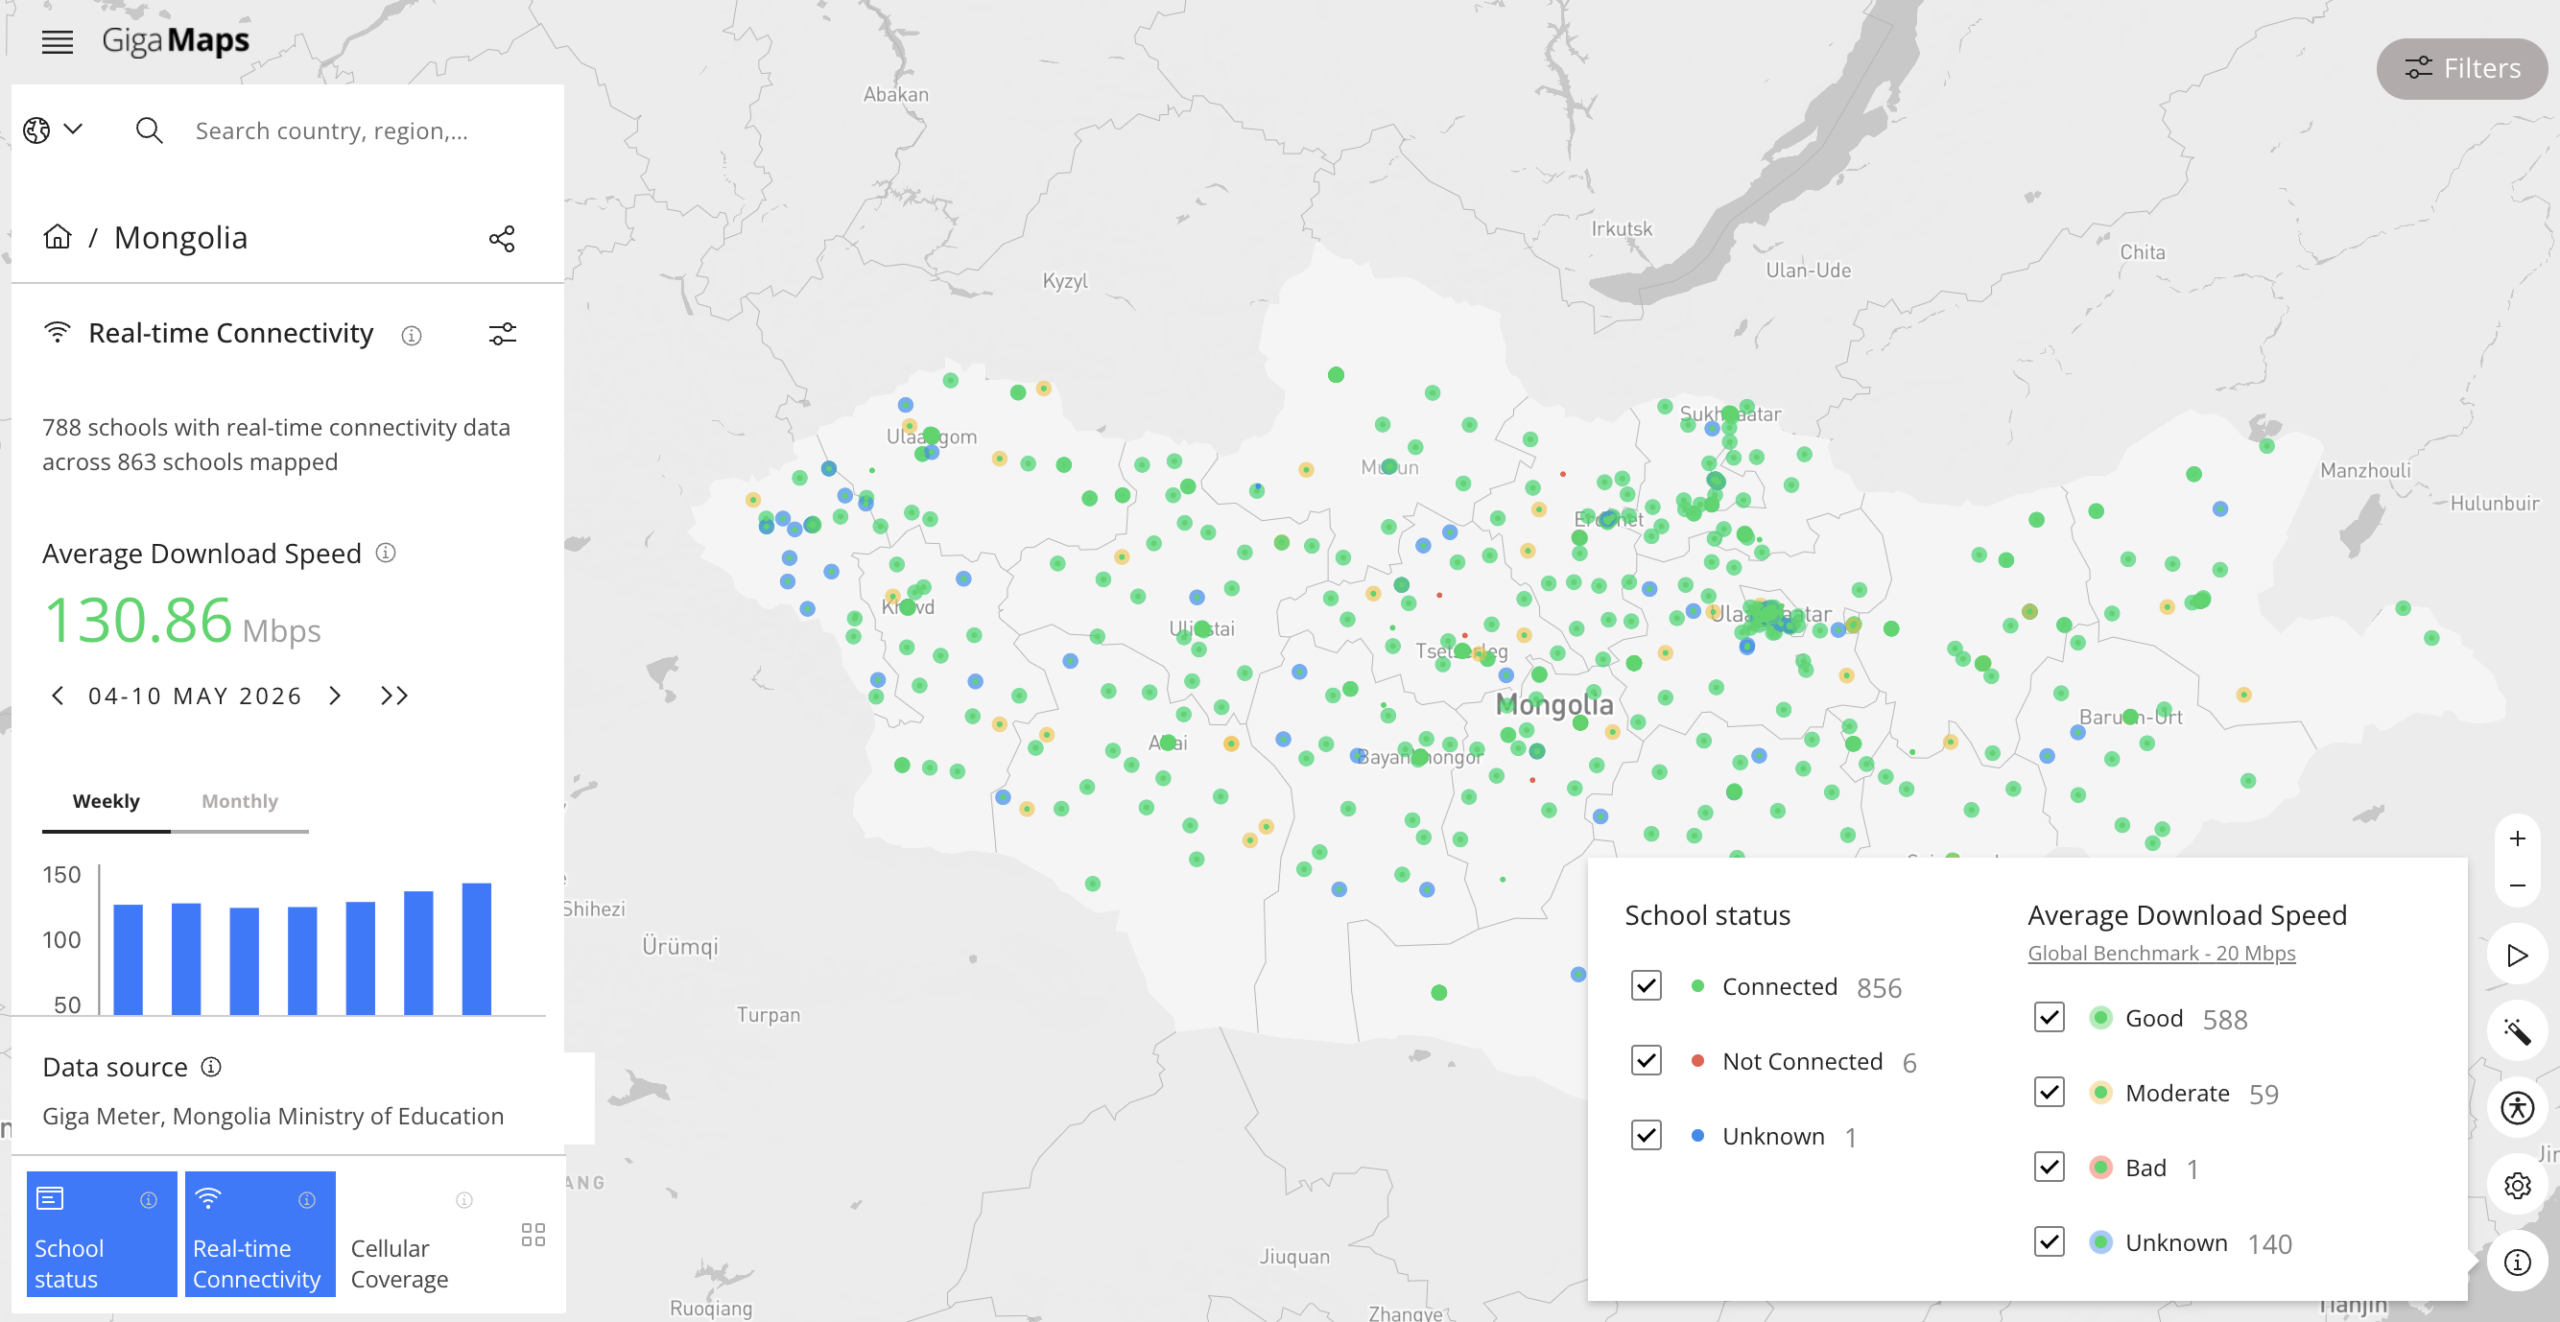
Mongolia’s Giga Meter data currently reports a national average download speed of 130 Mbps, as measured on devices used in schools. This figure puts Mongolian schools ahead of the national consumer broadband median (83.25 Mbps). On paper, that reads as ample headroom for twenty students to take an online exam at the same time.
A number this strong points to a connectivity story that is largely resolved, with attention and resources free to shift toward devices, classroom equipment, and digital learning content.
The 130 Mbps headline, however, tells one part of a longer story. It measures how well schools reach content hosted in-country, such as Mongolia’s national learning platform, ministry portals, and any international content that’s already cached locally. What it doesn’t measure is how well schools reach content hosted internationally – the wider Public Internet, where most popular educational resources sit. Under good network conditions, 79% of schools can successfully stream a video hosted domestically, but only 42% can when the video sits abroad.
This blog explains why both things can be true, and what it means for the Government of Mongolia’s continued investment in school connectivity.
Mongolia’s internet geography
The internet isn’t a single network with one speed. Every piece of content a student opens, say a Wikipedia page, takes a different physical journey to get to their device. The time that journey takes depends on more than just distance: it depends on where the content is hosted, how many networks the traffic has to cross, the technology each of those networks uses (e.g. fibre, satellite, wireless), how much capacity they have, and how congested they are at that moment, among other factors.
Mongolia is landlocked, with no direct submarine cable connection. A request from a school for content hosted abroad must cross a border on terrestrial fibre — through Russia or China — before reaching transit providers in Hong Kong, Singapore, or Frankfurt and finally the target destination. A request for content hosted in Mongolia, by contrast, stays inside the country’s network — a short path between the school, the national education backbone, and a domestic server. The difference in these two paths is what makes Mongolia’s internet quality so uneven from a student’s perspective, and exactly why measuring it matters.
From device to measurement server
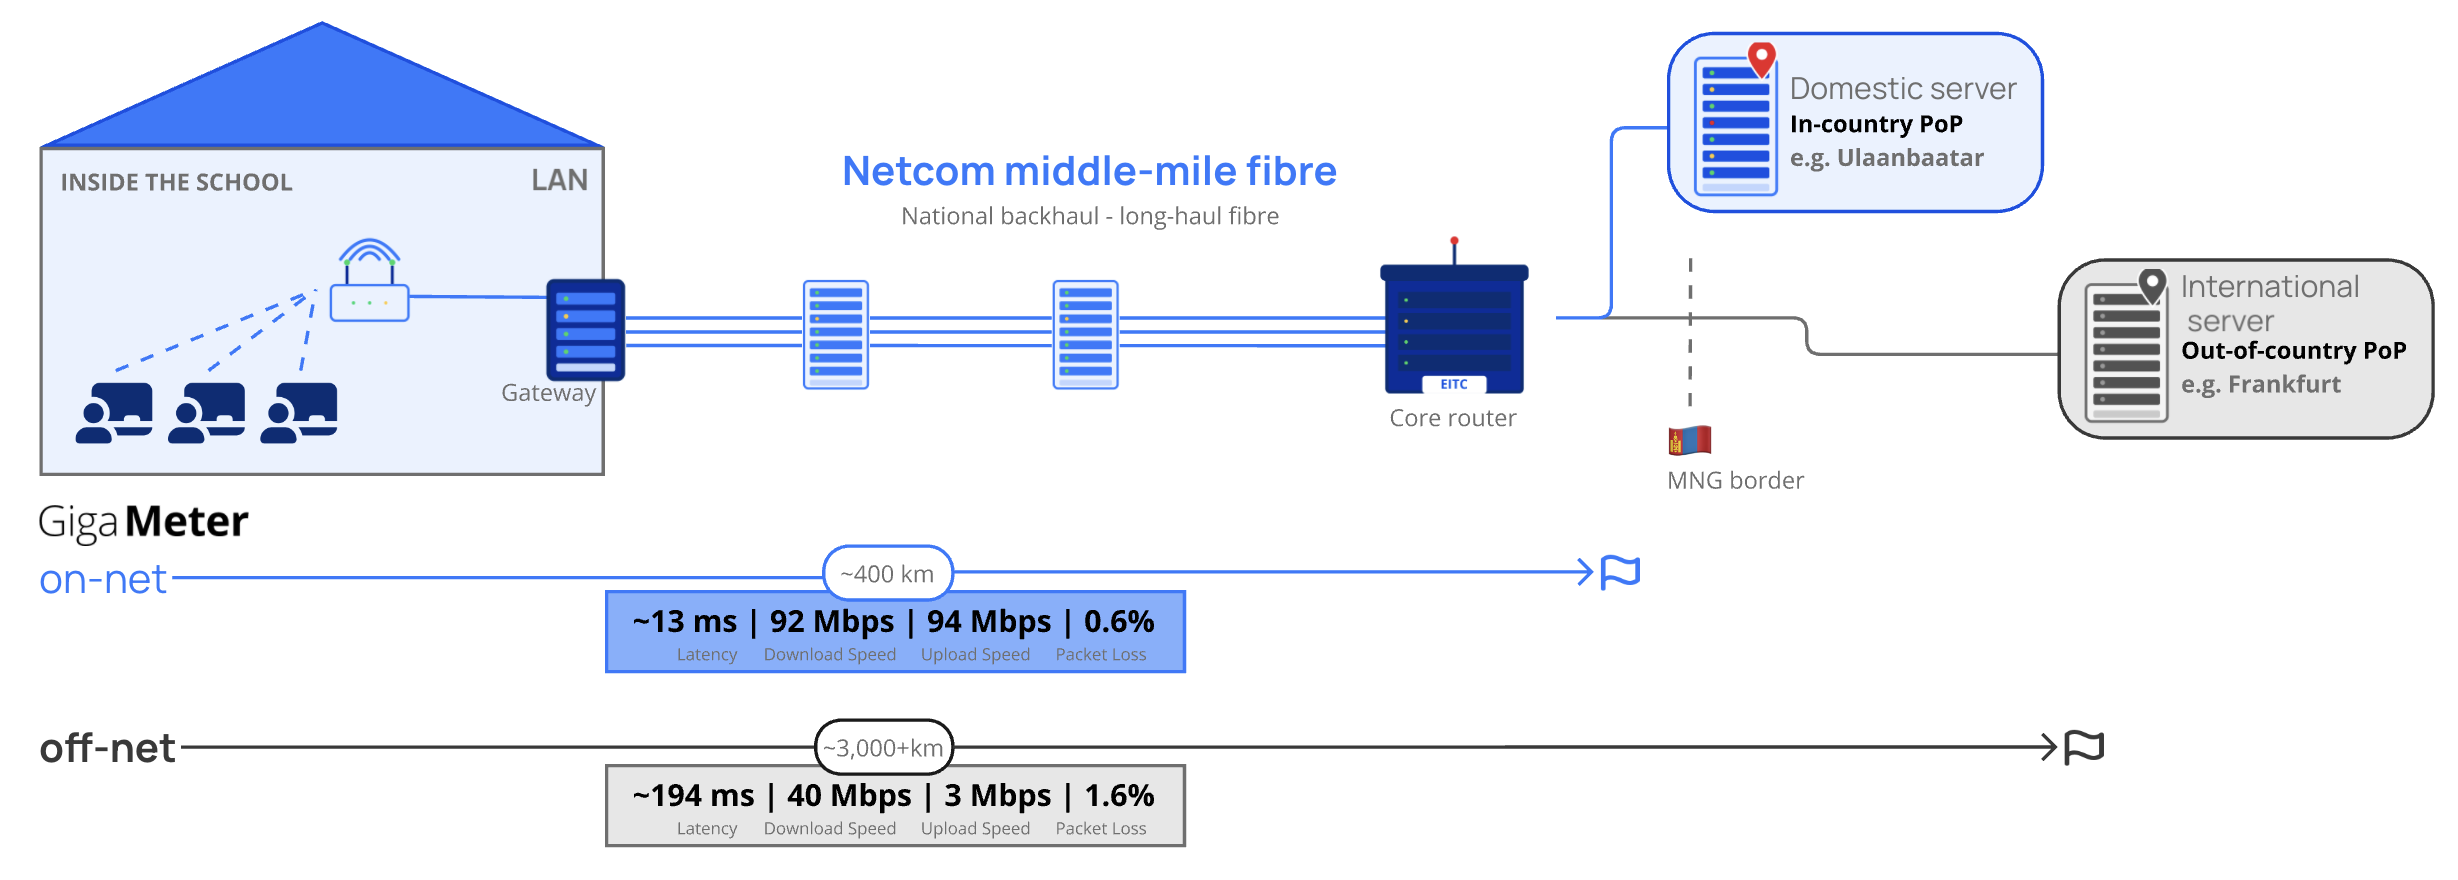
Giga Meter measures the connection end-to-end to an Internet resource.
Since 2022, Giga has worked with the Education Information Technology Center (EITC) of Mongolia’s Ministry of Education to measure internet quality in schools. Giga Meter — a lightweight application now deployed across nearly 800 schools — runs automated tests daily, measuring the connection a student actually experiences end-to-end, from a user device, through the school’s internal network and out across the country’s infrastructure to the test server. Where the test server sits determines which path is measured, and consequently, what the metrics tell us about a school’s connectivity quality.
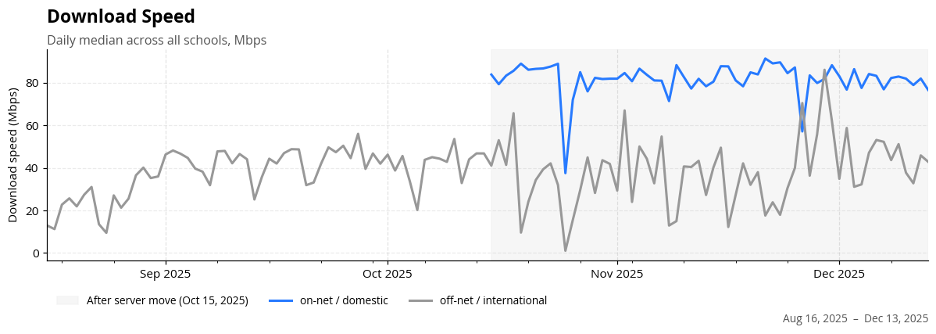
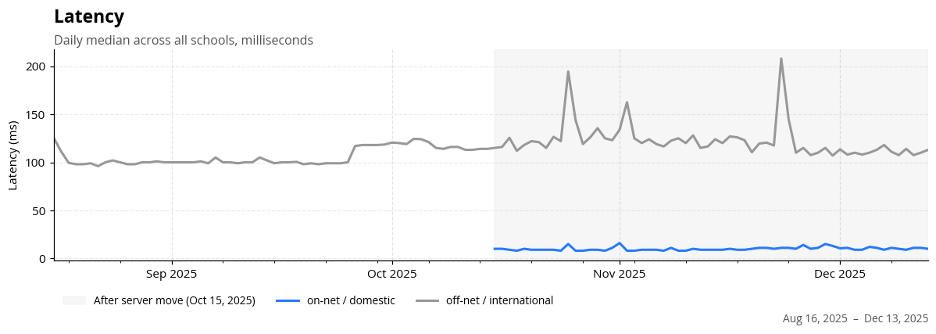
When measuring against domestically hosted content, latency dropped from a national median of 116 ms to 8 ms. Where measurements previously traversed an average of 7 IP hops across 3,200 km to reach a server in Seoul they now reach the in-country server in 5 hops across 339 km, eliminating the long-haul cross-border leg. Speeds rose accordingly, from 49 to 86 Mbps.
Download speed measures how much data per second the connection can pull to a student’s device. It’s what determines whether a video plays smoothly, how long a textbook PDF takes to download, and how many students can do those things at the same time without slowing each other down.
Upload speed is how much data the connection can send out. It matters whenever a student is the one producing data — appearing on camera in a video call, submitting an exam, syncing work to a shared drive.
Latency is the time it takes for data to travel from a student’s device to the server hosting what they’re trying to reach and back. High latency is what causes interactive applications to feel unresponsive: the pause before a video call connects, the gap between clicking a link and seeing the page appear. Speed and latency are independent: a connection can be very fast and still feel slow if every interaction starts with a long wait.
Packet loss is the share of data that fails to reach their destination. Even small amounts cause video calls to stutter and pages to stall, because the connection keeps pausing to recover what’s missing. A school can have high speed and low latency and still feel frustrating to use if loss is significant.
Up until October 2025, Giga Meter measurement servers for Mongolia reached targets in Seoul, Taipei and Lahore. To better measure the rapidly growing share of education content hosted inside Mongolia — including MoE’s medle.mn platform — Giga and EITC set up a new measurement server inside the national education network. It came online on October 15, 2025. With this updated measurement path, instead of reaching an international server, schools in Mongolia started testing against an in-country one, where over 20,000 digital education materials are hosted, just a few network hops away. The move sharpened visibility into the domestic path — but it also created a new gap that Giga and EITC will close together.
When measuring against domestically hosted content, latency dropped from a national median of 116 ms to 8 ms. Where measurements previously traversed an average of 7 IP hops across 3,200 km to reach a server in Seoul they now reach the in-country server in 5 hops across 339 km, eliminating the long-haul cross-border leg. Speeds rose accordingly, from 49 to 86 Mbps.
Download speed measures how much data per second the connection can pull to a student’s device. It’s what determines whether a video plays smoothly, how long a textbook PDF takes to download, and how many students can do those things at the same time without slowing each other down.
Upload speed is how much data the connection can send out. It matters whenever a student is the one producing data — appearing on camera in a video call, submitting an exam, syncing work to a shared drive.
Latency is the time it takes for data to travel from a student’s device to the server hosting what they’re trying to reach and back. High latency is what causes interactive applications to feel unresponsive: the pause before a video call connects, the gap between clicking a link and seeing the page appear. Speed and latency are independent: a connection can be very fast and still feel slow if every interaction starts with a long wait.
Packet loss is the share of data that fails to reach their destination. Even small amounts cause video calls to stutter and pages to stall, because the connection keeps pausing to recover what’s missing. A school can have high speed and low latency and still feel frustrating to use if loss is significant.
The same pattern shows up at the ISP level, summarized below:
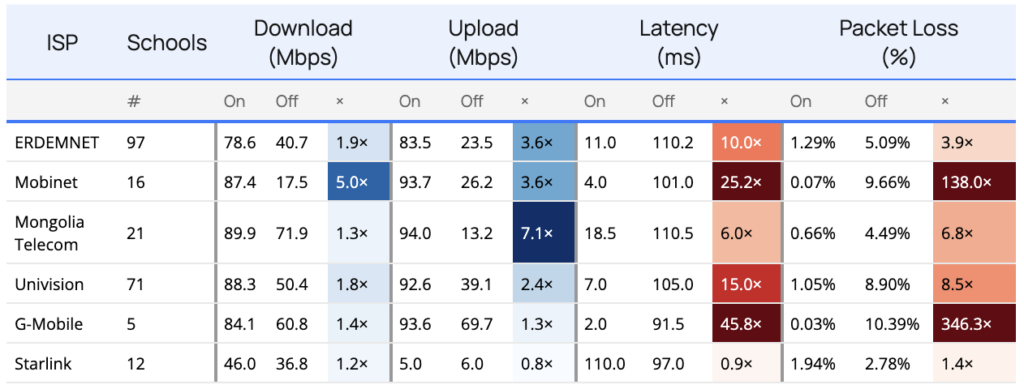
On = domestic server (in-country). Off = international server. × = ratio between the two; for download and upload, higher is better; for latency and packet loss, lower is better.
Every ISP except for Starlink recorded a 2-100× change on at least one key metric. Packet loss, in particular, decreased significantly: Mobinet and G-Mobile both went from near 10% loss on the international path to effectively zero on the domestic one. Latency improvements were similarly large for every ISP with terrestrial infrastructure, avoiding the long international leg.
Starlink is the exception. Schools on Starlink show almost no change between the domestic and international measurements, because in Mongolia, Starlink routes traffic through ground stations in Japan before reaching any server. Even a request for content hosted in Mongolia exits the country first. Schools on Starlink experience international-path performance at all times, regardless of where the content sits.
Better speeds are good news, but speed is only one of the metrics that determine what a connection can support. Speed alone doesn’t answer how well a student can use the internet for digital education.A 130 Mbps connection with 200 ms latency and 5% packet loss fails at video calls. A 50 Mbps connection with 20 ms latency and no loss handles them fine. A new measurement scoring framework, called the Internet Quality Barometer (IQB), reframes the question. Instead of focusing on speed only, it asks: Can this school support a video lesson? Can it run an online exam? Can students take a remote assessment?
IQB was developed by Measurement Lab (M-Lab), an open-source internet measurement platform running internet measurements at internet scale since 2009. The IQB combines download and upload speed, latency, and packet loss into a single score per category of activity, such as web browsing, video streaming, audio streaming, video conferencing, online backup, and video gaming, with an associated pass/fail.
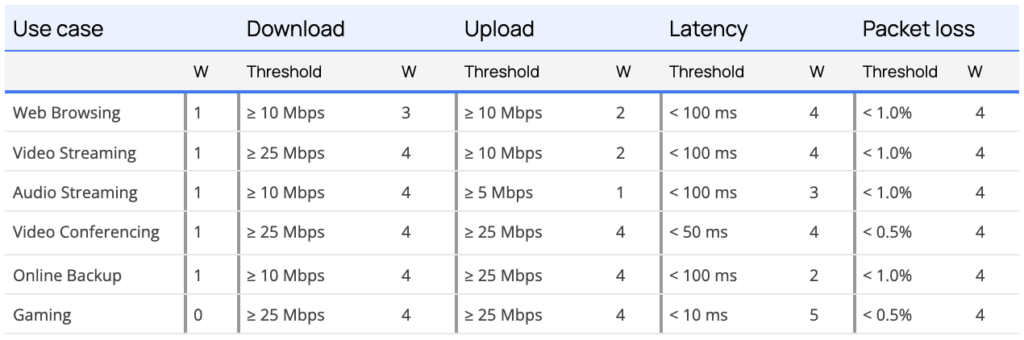
Each requirement is assigned a threshold and weight (W) from 0 to 5 based on expert consultation, indicating how much that metric matters for the use case. The IQB score for each use case is a weighted average of whether the connection clears each threshold.
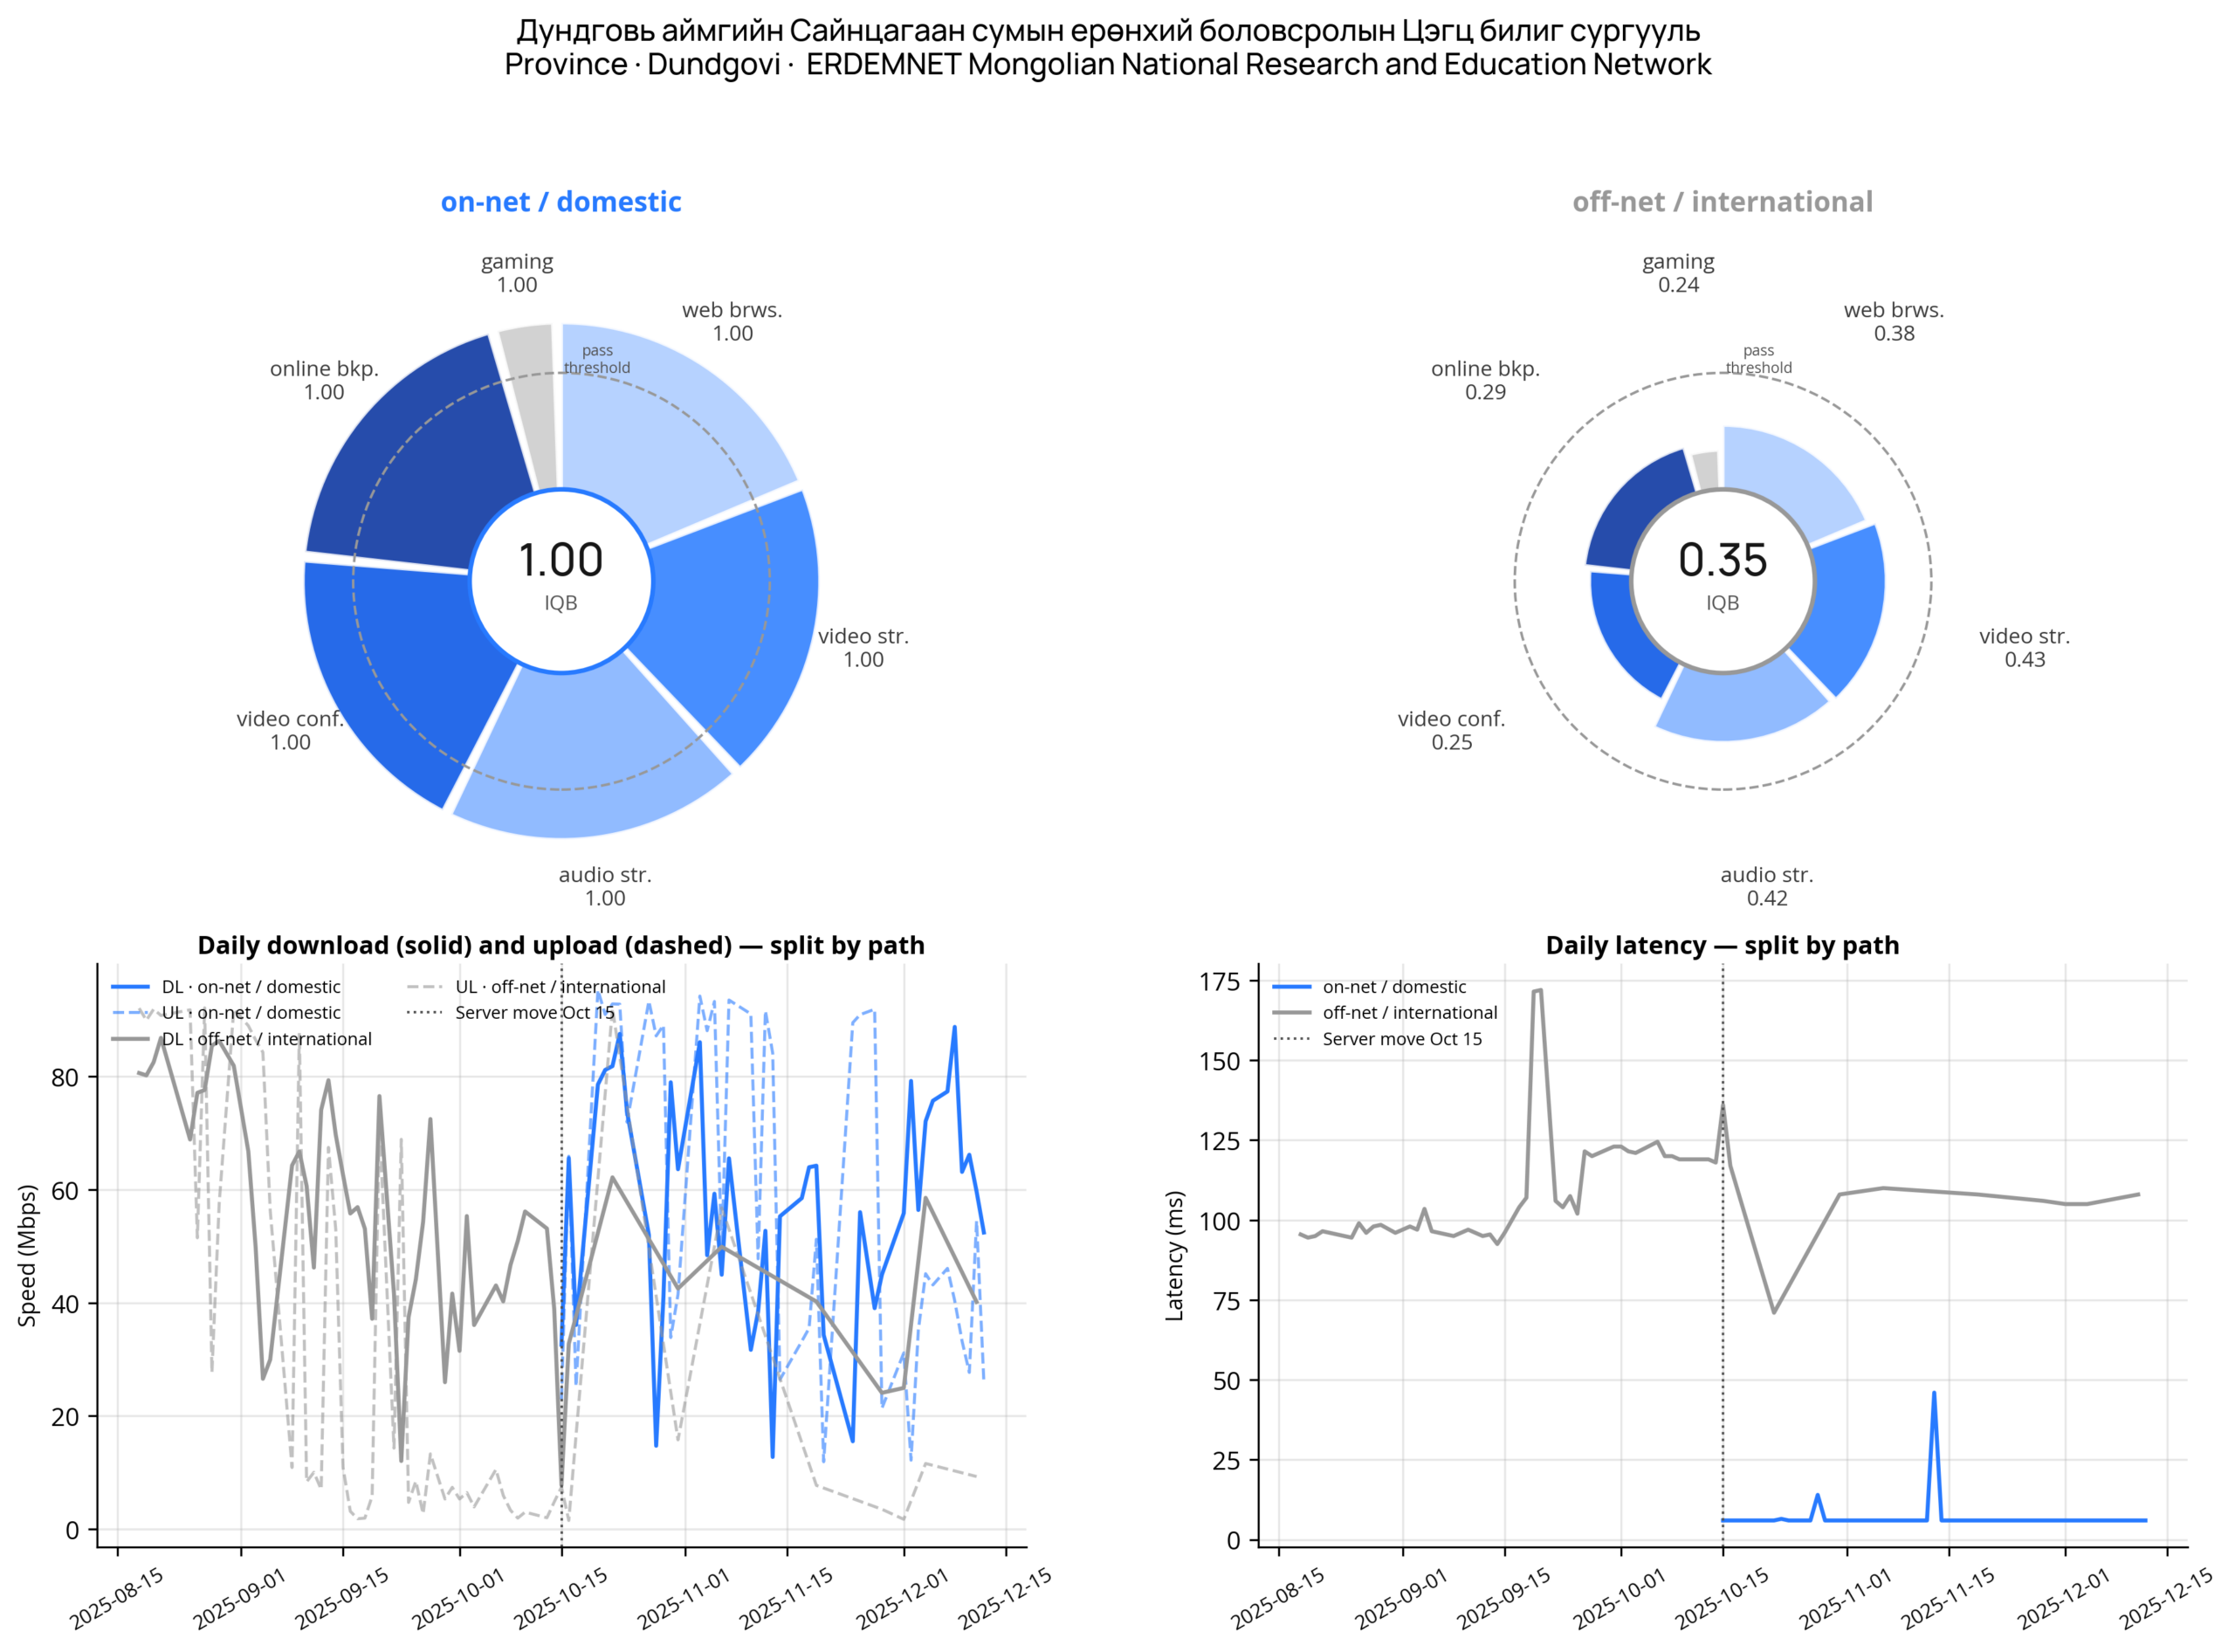
Running Mongolia’s schools through the IQB makes the gap between the two paths concrete. On the international path, 42% of schools achieved an IQB score of 1 — the threshold for reliable video streaming — compared to 79% when measured against the domestic server. More than half of the schools cannot reliably stream a video sourced from outside the country. This doesn’t mean the internet is unusable. It does mean most schools cannot reliably support these online activities when the traffic has to leave the country.
Three takeaways for policy
- The 130 Mbps figure is real.Mongolia has built a domestic education infrastructure worth celebrating. The national network delivers students frictionless access to locally hosted content at high speeds with single-digit millisecond latency and near-zero packet loss. Growing the share of relevant content accessible via domestic infrastructure — whether through in-country hosting, government-operated mirrors, or CDN edge deployments — will extend this low-latency, low-loss performance to more resources.
- However, students draw on both domestic and international content daily. A useful school connection is one that supports the activities students need, regardless of where each resource is hosted. Measuring only the stronger path introduces an upward bias that consistently overstates the overall quality of student experience. The move to a domestic measurement improved precision for in-country content; it also, unintentionally, reduced visibility into the international path. Rebalancing the sampling ratio in our measurement strategy toward a more even split across the two paths will restore that visibility. Giga will implement this adjustment across the Mongolia deployment in coordination with EITC.
- Speed is one of a few metrics that determine what a connection can support. Latency and packet loss matter as much, and sometimes more. Benchmarks codified in speed alone, whether in the next Digital Education Policy, or in school connectivity targets, will not capture whether a school connection can support the activities expected of it. School connectivity monitoring strategies should reflect end-user experience, rather than infrastructure capability alone.
Methodological Note
The analysis covers Mongolia’s Giga Meter school cohort across an Aug 16 – Dec 14, 2025 window — 60 days on each side of the October 15, 2025 measurement server change. To compare pre- and post-move performance on like-for-like terms, we restrict to a balanced cohort of schools with at least 30 measurements against the international server and 30 against the new in-country server. Composite IQB is computed at two operating points per school: typical conditions (median, p50) and favorable conditions (p95 for throughput, p5 for latency and packet loss).
Read more: www.measurementlab.net/blog/iqb/